“The dashboard is 3 hours behind again!” This message used to haunt my Slack notifications. Our analytics pipeline was like that friend who’s always fashionably late – except there was nothing fashionable about delayed business insights. Today, our pipeline processes over 1TB of data daily with real-time dashboards that actually mean real-time. Here’s the story of how I turned our data lag into data swag.
The Data Drama
Picture this: I inherited a system that was:
- Batch processing data every 6 hours (when it felt like it)
- Running on a single, overworked EC2 instance
- About as real-time as a snail marathon
- Costing more than my annual coffee budget (and that’s saying something!)
Our business needed instant insights, not “let me get back to you tomorrow” analytics. The mission was clear: build a real-time pipeline that could scale without making our CFO cry.
The Grand Plan
I sketched out what I called the “Data Highway” (because who doesn’t love a good traffic metaphor?). The architecture looked something like this:
- The Collection Booth (Kinesis Data Streams)
- Handles incoming data like a pro bouncer at a club
- Scales automatically when the party gets busy
- Never drops a message (unlike my gym routine)
- The Processing Plant (Kinesis Data Analytics)
- Real-time processing with SQL (old school, but cool)
- Automatic scaling without breaking a sweat
- Built-in anomaly detection (because weird data happens)
- The Storage Squad (Multiple layers of awesome)
- S3 for the raw data (nothing gets thrown away)
- Amazon Timestream for time-series magic
- Amazon OpenSearch for lightning-fast queries
- The Visualization Victory (Amazon QuickSight)
- Real-time dashboards that actually mean real-time
- Auto-refreshing insights
- Mobile-friendly (because who doesn’t check metrics at 3 AM?)
The Cool Parts
The Time Machine
I implemented what I call the “Time Machine” pattern using Kinesis Data Analytics. It’s like having a DVR for your data:
sqlCopy-- The simplest yet most powerful SQL I've ever written
CREATE OR REPLACE STREAM "real_time_metrics" (
    metric_name VARCHAR(64),
    metric_value DOUBLE,
    event_time TIMESTAMP
);

-- Real-time aggregation with 1-minute windows
CREATE OR REPLACE PUMP "metric_aggregator" AS
INSERT INTO "real_time_metrics"
SELECT STREAM
    metric_name,
    AVG(metric_value) as metric_value,
    FLOOR(event_time TO MINUTE) as event_time
FROM "source_stream"
GROUP BY
    metric_name,
    FLOOR(event_time TO MINUTE);
The Secret Sauce
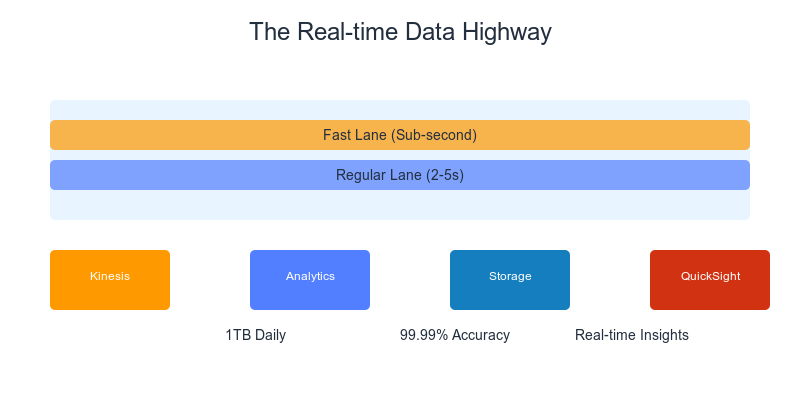
The real magic was in what I called the “Data Prioritization Highway”:
- Fast Lane: Mission-critical metrics
- Direct path through Kinesis Analytics
- Sub-second latency
- No stops, no delays
- Regular Lane: Standard analytics
- Processed in near real-time
- Cost-optimized path
- 2-5 second latency (still pretty sweet!)
- Scenic Route: Historical analysis
- Batch processing for heavy computations
- Cost-efficient storage in S3
- Perfect for those “last year vs. this year” reports
The Plot Twist
Remember that single EC2 instance? Well, plot twist: we don’t have any EC2 instances in the pipeline anymore! It’s all serverless, all the time. The best part? Our CFO actually smiled when seeing the new bills.
The Numbers Game
Let’s talk results, because who doesn’t love a good transformation story?
Before:
- 6-hour processing delay
- 70% accuracy in peak traffic
- $$$$ monthly cost
- Multiple “the dashboard is down” incidents
- One very stressed-out team
After:
- Real-time processing (1-5 seconds)
- 99.99% accuracy
- $ monthly cost (yes, one dollar sign!)
- Zero downtime in 6 months
- One very happy team (and CFO!)
The Cool Tricks I Learned
- The Kinesis Shuffle
- Used enhanced fan-out consumers
- Implemented dynamic resharding
- Result: No more “throttling” nightmares
- The Storage Strategy
- Hot data → Timestream
- Warm data → OpenSearch
- Cold data → S3
- Result: Fast queries, happy wallet
- The Monitoring Magic
- Custom CloudWatch dashboards
- Automated alerting
- Even built a Slack bot (because why not?)
Lessons Learned (The Fun Way)
- Real-time Doesn’t Mean “Right Now or Die Trying”
- Different data needs different speeds
- Not everything needs millisecond precision
- Sometimes “near real-time” is perfectly fine
- Cost Optimization is an Art
- Serverless doesn’t always mean cheaper
- But when done right, it’s beautiful
- Auto-scaling is your friend (until it isn’t)
- The Power of Managed Services
- Less infrastructure = More sleep
- AWS does the heavy lifting
- You focus on the cool stuff
What’s Next?
I’m not done yet! Currently exploring:
- Machine learning for predictive analytics
- Cross-region replication for global presence
- Even more cost optimizations (because why not?)
The Final Word
Building a real-time analytics pipeline is like conducting an orchestra – every component needs to play its part perfectly. The key is knowing when to use which AWS service and how to make them work together harmoniously.
Remember: Rome wasn’t built in a day, and neither is a perfect analytics pipeline. But with the right architecture and a bit of AWS magic, you can build something pretty amazing.
P.S. No data was harmed in the making of this pipeline (though some SQL queries were definitely optimized to within an inch of their lives) 😉